


Headline figures
| Measure | Value | Period | Source |
|---|---|---|---|
| Median sale price | $1,149,239 (down 5.0% year over year) | August 2026 | Redfin |
| Median sale price per square foot | $294 (up 12.2% year over year) | 3 months ending August 2026 | Redfin |
| Homes sold | 40 (39 a year earlier) | August 2026 | Redfin |
| Median days on market | 85 (84 a year earlier) | August 2026 | Redfin |
| Sale-to-list price ratio | 95.3% (down 0.42 points) | August 2026 | Redfin |
| Homes sold above list price | 2.6% | August 2026 | Redfin |
| Homes with price drops | 51.7% (up 7.6 points) | August 2026 | Redfin |
| Zillow Home Value Index | $1,052,403 (down 0.3% year over year) | August 31, 2026 | Zillow |
| For-sale inventory | 66 homes | September 30, 2026 | Zillow |
| Median list price | $1,195,150 | September 30, 2026 | Zillow |
| Median 2026 certified market value (appraisal), homes inside city limits | $1,128,000 | Tax year 2026 | Collin CAD |
| Median value, owner-occupied homes | $941,900 | 2020 to 2024 ACS estimate | U.S. Census Bureau |
| Average taxable homestead value | $1,021,510 (up from $961,178 in 2025) | Tax year 2026 | City of Lucas |
Redfin rated Lucas "somewhat competitive" (Compete Score 37 of 100) for the period, noting that the average home sold about 5% below list price and went pending in about 80 days.
A note on what the numbers include
Portal data for "Lucas" is usually based on mailing address or city boundaries as each site defines them. Collin Central Appraisal District (Collin CAD) records show about 2,710 homes inside the Lucas city limits and about 930 more with Lucas mailing addresses outside them, mainly in Seis Lagos, Brockdale Estates, Commons of Camden and the Lucas-addressed section of Inspiration. Those outside communities are built on lots of about half an acre or less, with a median 2026 appraisal of about $759,000, so their sales can pull citywide medians and counts in a different direction than the estate subdivisions. Monthly figures on a base of about 40 sales also move sharply from month to month, so look at several months before drawing conclusions.
Reading the sales data
The August 2026 numbers point to a market where buyers had time and leverage:
- Longer marketing times. A median of 85 days on market was essentially unchanged from a year earlier, and Redfin's "hot homes" still took about 56 days to go pending.
- Negotiation below list. A 95.3% sale-to-list ratio and only 2.6% of homes selling above list show that most sales closed under asking price.
- Frequent price cuts. More than half of listings had a price reduction, up 7.6 points from August 2025.
- Mixed price signals. The median sale price fell 5.0% while price per square foot rose 12.2%, which suggests a shift in the size or type of homes that sold rather than a uniform change in values. Zillow's index was essentially flat year over year.
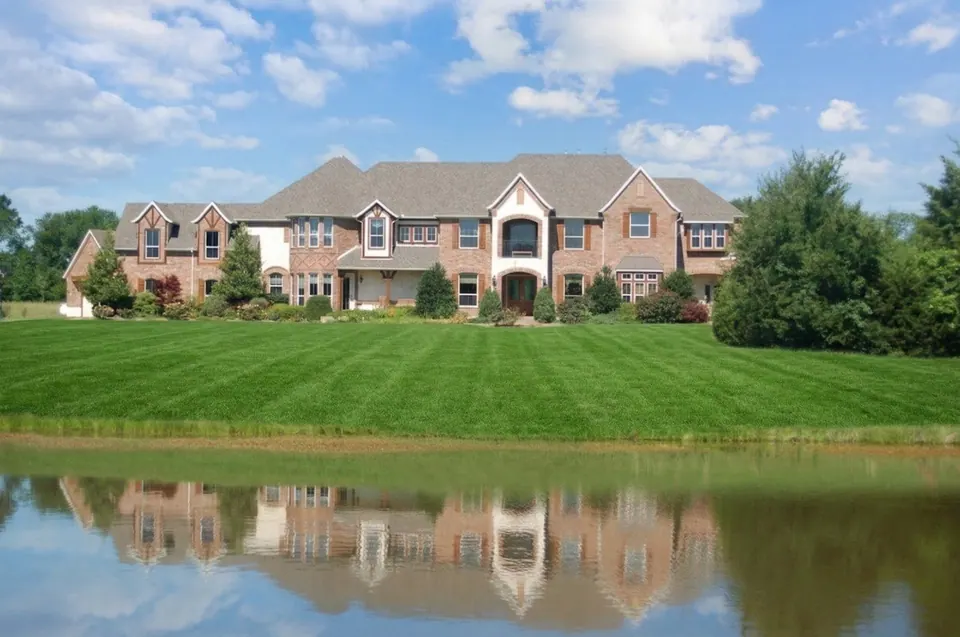
Value tiers (2026 appraisal)
The 2026 certified market values for the 2,670 completed single-family homes inside the city limits (41 homes still under construction on January 1, 2026 are left out). These are appraisal values, not sale prices.
| 2026 certified market value (appraisal) | Homes | Share |
|---|---|---|
| Under $500,000 | 85 | 3.2% |
| $500,000 to $999,999 | 917 | 34.3% |
| $1 million to $1.49 million | 1,099 | 41.2% |
| $1.5 million to $1.99 million | 317 | 11.9% |
| $2 million to $2.99 million | 193 | 7.2% |
| $3 million or more | 59 | 2.2% |
Nearly two thirds of homes in the city limits carry a 2026 appraisal of $1 million or more. The tiers differ by school district:
| ISD | Homes | Under $1M | $1M to $1.99M | $2M+ | Median 2026 value |
|---|---|---|---|---|---|
| Lovejoy | 1,790 | 647 | 946 | 197 | $1.18M |
| Plano | 352 | 127 | 200 | 25 | $1.14M |
| McKinney | 299 | 127 | 150 | 22 | $1.06M |
| Allen | 135 | 40 | 92 | 3 | $1.07M |
| Wylie | 83 | 63 | 15 | 5 | $0.74M |
| Princeton | 52 | 38 | 14 | 0 | $0.92M |
This table counts all 2,711 homes, including the 41 under construction, which mostly fall in the under-$1 million column. The luxury homes page lists where the $2 million and $3 million homes are by subdivision.
Age of the housing stock
| Decade built | Homes | Share | Median living area | Median 2026 value |
|---|---|---|---|---|
| Before 1970 | 74 | 2.7% | 1,820 sq ft | $672,000 |
| 1970s | 248 | 9.1% | 2,480 sq ft | $736,000 |
| 1980s | 319 | 11.8% | 2,580 sq ft | $821,000 |
| 1990s | 266 | 9.8% | 3,280 sq ft | $1,002,000 |
| 2000s | 669 | 24.7% | 4,300 sq ft | $1,184,000 |
| 2010s | 726 | 26.8% | 4,630 sq ft | $1,351,000 |
| 2020s | 409 | 15.1% | 4,860 sq ft | $1,358,000 |
The 2020s row counts 33 homes built in 2024, 41 in 2025 and 41 that were under construction on January 1, 2026; values for that row leave out the unfinished homes. The median Lucas home was built in 2006. About a third of the stock dates from before 2000, and those homes sit on the largest lots in town.
Lot sizes and large-lot inventory
| Lot size | Homes | Share | Median 2026 value |
|---|---|---|---|
| Under 1 acre | 39 | 1.4% | $454,000 |
| 1 to 1.49 acres | 747 | 27.6% | $1,133,000 |
| 1.5 to 1.99 acres | 541 | 20.0% | $1,157,000 |
| 2 to 2.99 acres | 992 | 36.6% | $1,045,000 |
| 3 to 4.99 acres | 214 | 7.9% | $1,138,000 |
| 5 to 9.99 acres | 134 | 4.9% | $1,622,000 |
| 10 acres or more | 44 | 1.6% | $2,662,000 |
Lot sizes are rounded to the nearest hundredth of an acre, and values leave out homes still under construction on January 1, 2026.
The median Lucas home sits on 2.0 acres. 1,384 homes (51%) are on 2 acres or more, 178 on 5 acres or more and 44 on 10 acres or more.
What the table shows:
- Land is a large share of value. With 1-acre and 2-acre minimums, a meaningful part of every sale price is land.
- Bigger lots do not always mean higher values. Homes on 2 to 2.99 acres carry a lower median appraisal than homes on 1 to 1.49 acres, because the 2-acre lots hold more of the older 1970s to 1990s homes. Age, size, finish level and school district can outweigh lot size.
- Very large lots break the pattern. Homes on 5 acres or more carry median appraisals of $1.6 million and up.
- Raw land is valued by the acre. Collin CAD's 2026 certified values for vacant residential lots inside the city limits work out to a median of about $189,000 per acre, and about $223,000 per acre for the 62 lots in Lovejoy ISD. These are appraisal values, not sale prices.
Vacant lots and open land
Collin CAD counted 159 vacant residential lots inside the city limits for 2026, totaling about 352 acres, with a median size of 2.0 acres and a median 2026 appraisal of about $307,000. By size, 16 are under 1 acre, 61 are 1 to 1.99 acres, 71 are 2 to 4.99 acres and 11 are 5 acres or more. The largest groups are in newer subdivisions: Enchanted Creek (25), Dean Farms (23), Hendrick Estates (16), Wildflower Estates (9) and New Castle Estates (6). By district, 62 are in Lovejoy ISD and 56 in Plano ISD.
Another 73 parcels, covering about 847 acres, are coded as agricultural land, and 167 more parcels with farm and ranch improvements cover about 1,288 acres.
Asking prices in published data
Aggregate and builder-published figures show where asking prices sit. Zillow put the Lucas median list price at $1,195,150 on September 30, 2026, with 66 homes for sale. In October 2026, NewHomeSource listed Enchanted Creek base prices from $1,263,900 (Perry Homes, 1-acre homesites) and from $1,895,000 (Our Country Homes). Outside the city limits, Ashton Woods listed plans in Inspiration (Wylie ISD) from $455,990 to $710,990 in 2026. These are asking or base prices, not sale prices.
Inventory patterns
- Zillow counted 66 homes for sale on September 30, 2026. Against roughly 40 sales in August, that is under two months of supply on a simple ratio, but sales in high price bands are uneven and the ratio varies by tier.
- New construction inside the city limits is concentrated in a few subdivisions. Of the 115 homes with a 2024 to 2026 year built, 41 are in Enchanted Creek and 14 in Hendrick Estates. Outside the city limits, the Inspiration community along Lavon Lake supplies small-lot production homes.
- Lucas's zoning and septic-based development limit how quickly new lots can be created, so resale homes make up most of the estate-tier inventory.
Property taxes and carrying costs
The City of Lucas tax rate for 2026 is $0.249880 per $100. The city estimated the average homestead's city tax at $2,552.55 for 2026. School district taxes are the largest part of the bill and vary by ISD. See the moving guide for the full rate table.
Sources (7)
- Collin Central Appraisal District parcel layer, 2026 certified values (hosted by the City of Allen GIS)
- Redfin: Lucas, TX housing market
- Zillow: Lucas, TX home values
- U.S. Census Bureau QuickFacts: Lucas city, Texas
- City of Lucas 2026 Notice of Meeting to Vote on Tax Rate
- Ashton Woods: Inspiration
- NewHomeSource: Lucas communities
Last reviewed October 2026. See something out of date? Email info@grisak.com.
 Schools
 Neighborhoods
 Moving to Lucas
 Homes we have sold
